Context
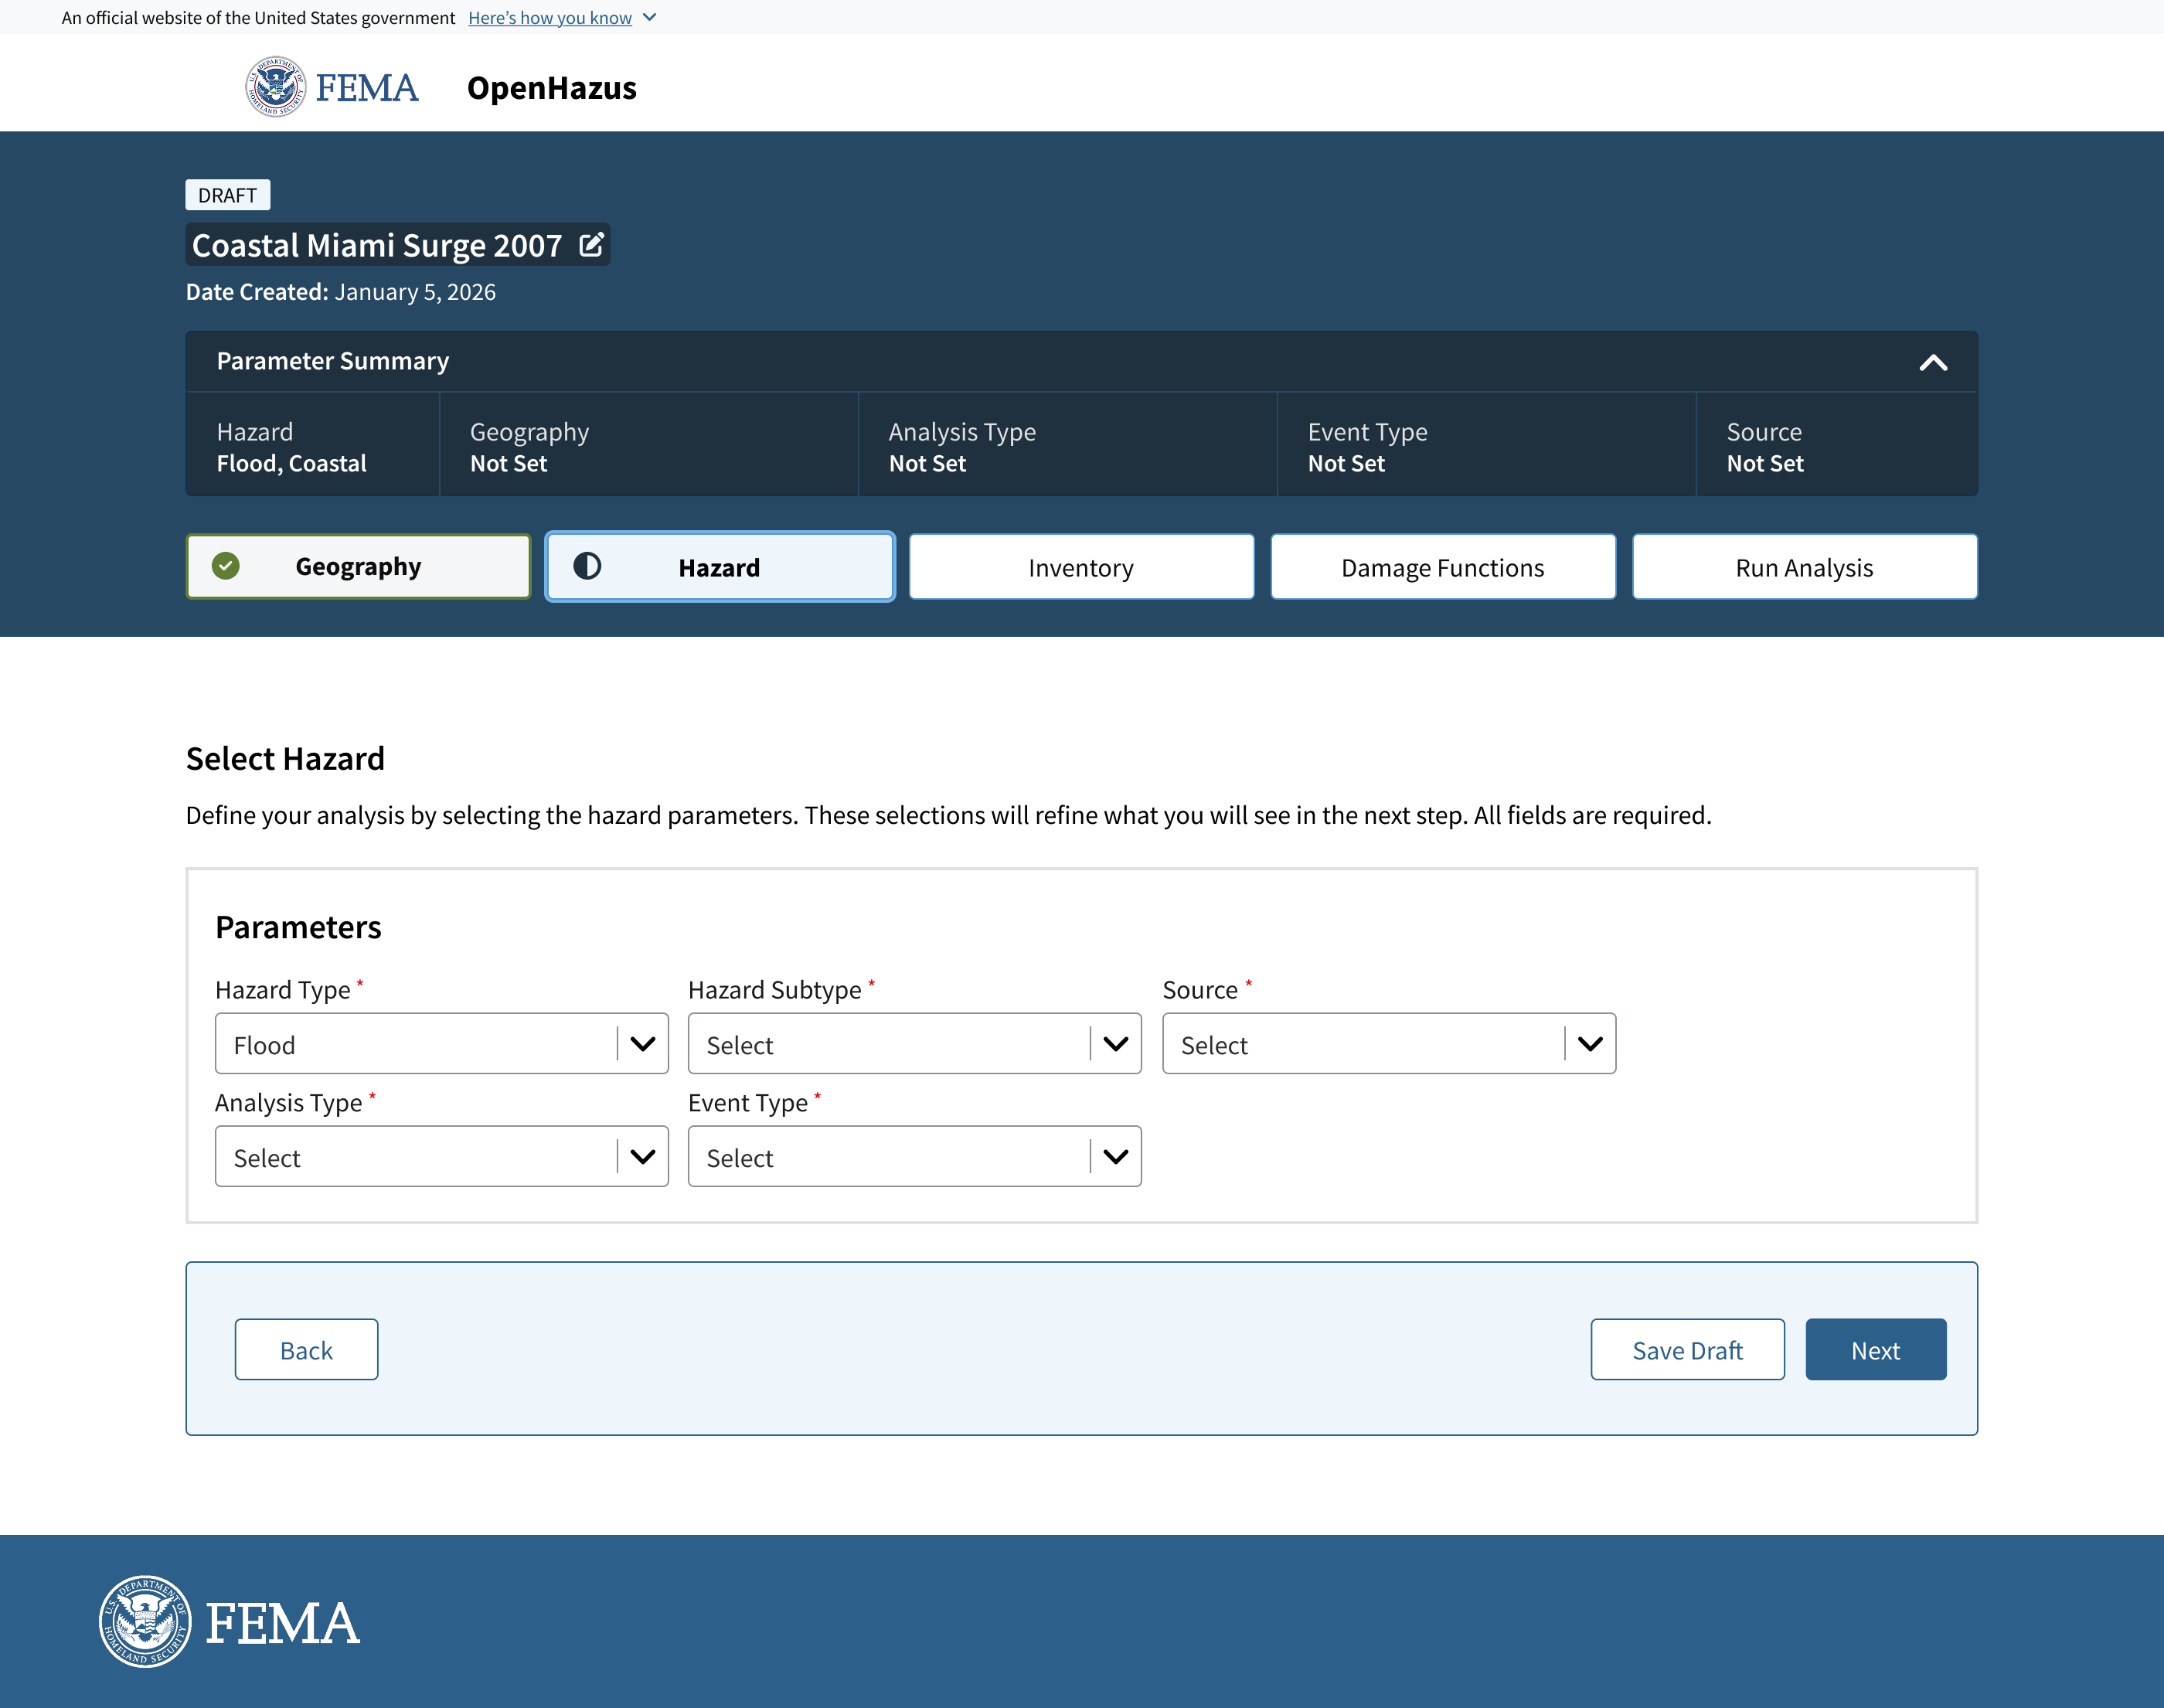
The Hazard Tab is the second step in OpenHazus. After analysts define a study area in the Geography Tab, they use the Hazard Tab to select settings like hazard type, data source, and analysis method.
These selections affect the analysis's accuracy, making this step as essential as defining the study area.
The updated Hazard Tab provides analysts with guidance through hints and information banners, showing progress and setting expectations at each step.
Problem
The experience relies on an interactive map viewer and modal windows, where hazard details are configured in parallel with map interactions rather than through a structured sequence.
The interface acts more as an open canvas, and the analysts move between fields and input parameters out of order, with no clear sense of completion. This lack of structure makes it difficult for less experienced users to know where to start, what is required, or whether their configuration is correct before running an analysis.
Core problems
-
Over-reliance on specialized knowledge
Hazus platforms assume users already understand their data formats and how each input connects to outputs. General users lack the confidence to configure analyses because the interface assumes they know the steps in advance.
 1
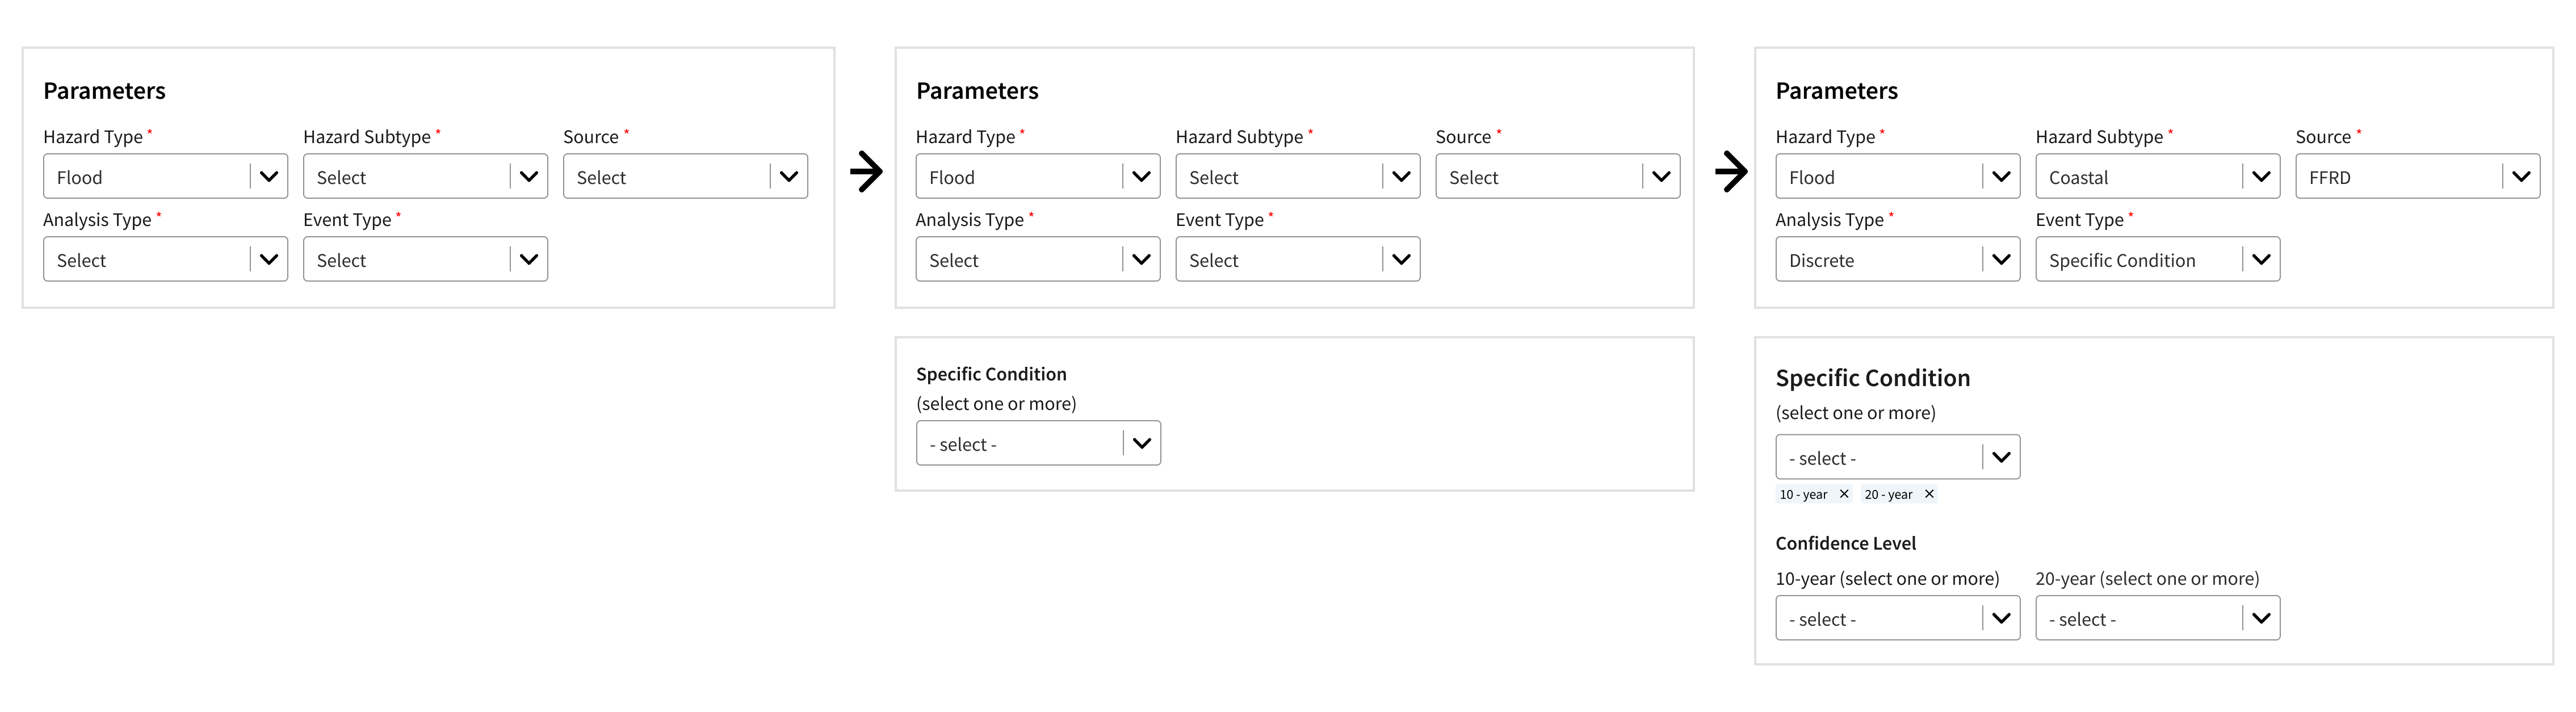
1In the earlier wireframes, the options for Specific Conditions and Annual Exceedance Frequency were separated from the event type dropdown and shown as individual dropdowns.
 2
2Depending on the choice made for Specific Conditions and Annual Exceedance Frequency, users must select additional options. Even with a multi-select component, things can get quite complicated when a few more options are added.
 3
3As the screenshot shows, once the user starts adding a few options, it quickly becomes very populated and becomes very unorganized.
-
Complex conditional parameters
Several inputs depend on earlier selections. Without clear guidance, users struggle to understand why options appear or disappear and how their choices affect analysis outcomes.
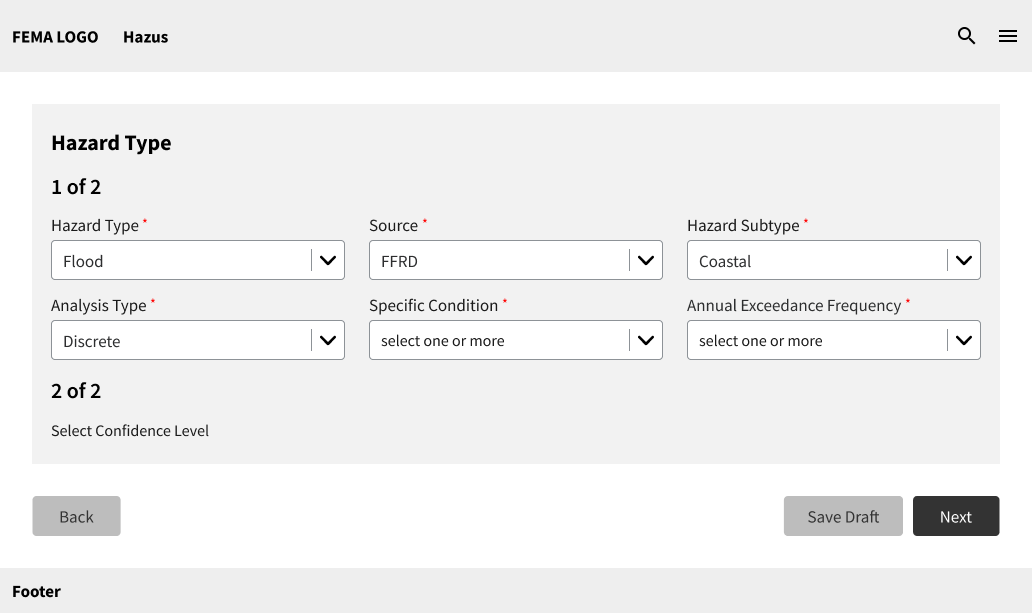
Previous Next.png) Step 01
Step 01Analysis Type selection
Users select either Discrete or Average Annualized Loss. This choice determines which Event Type options become available next.
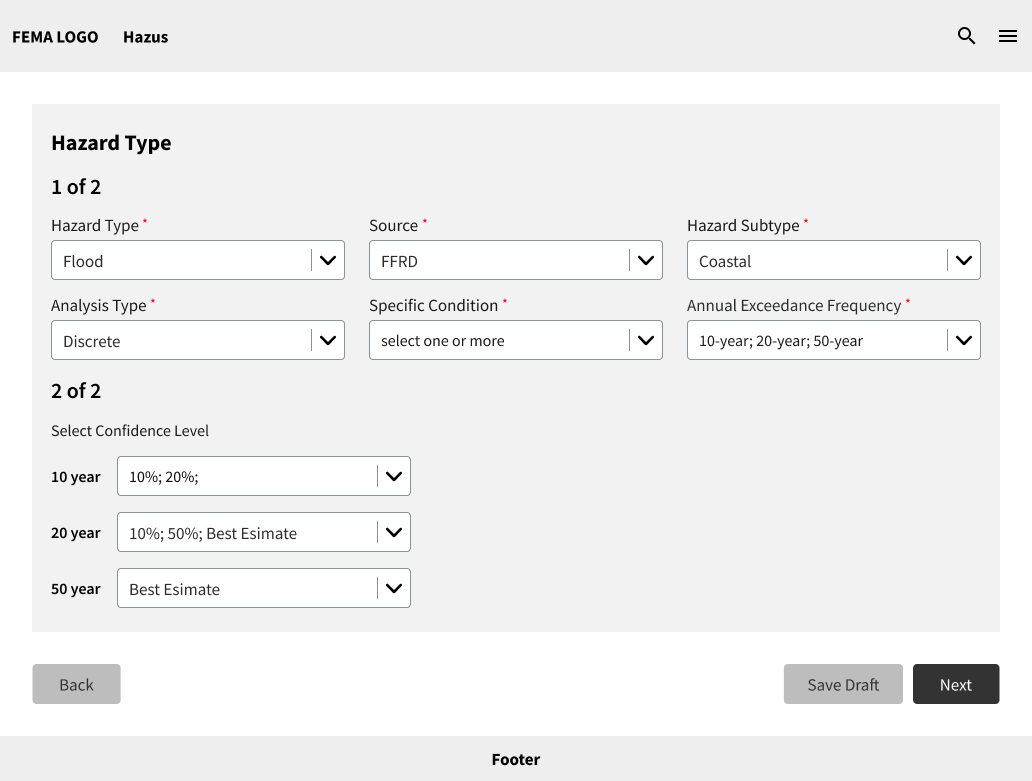
.png) Step 02
Step 02Event Type options shift
Selecting Average Annualized Loss automatically forces Event Type to Annual Exceedance Frequency. Without explanation, this feels like unexpected behavior.
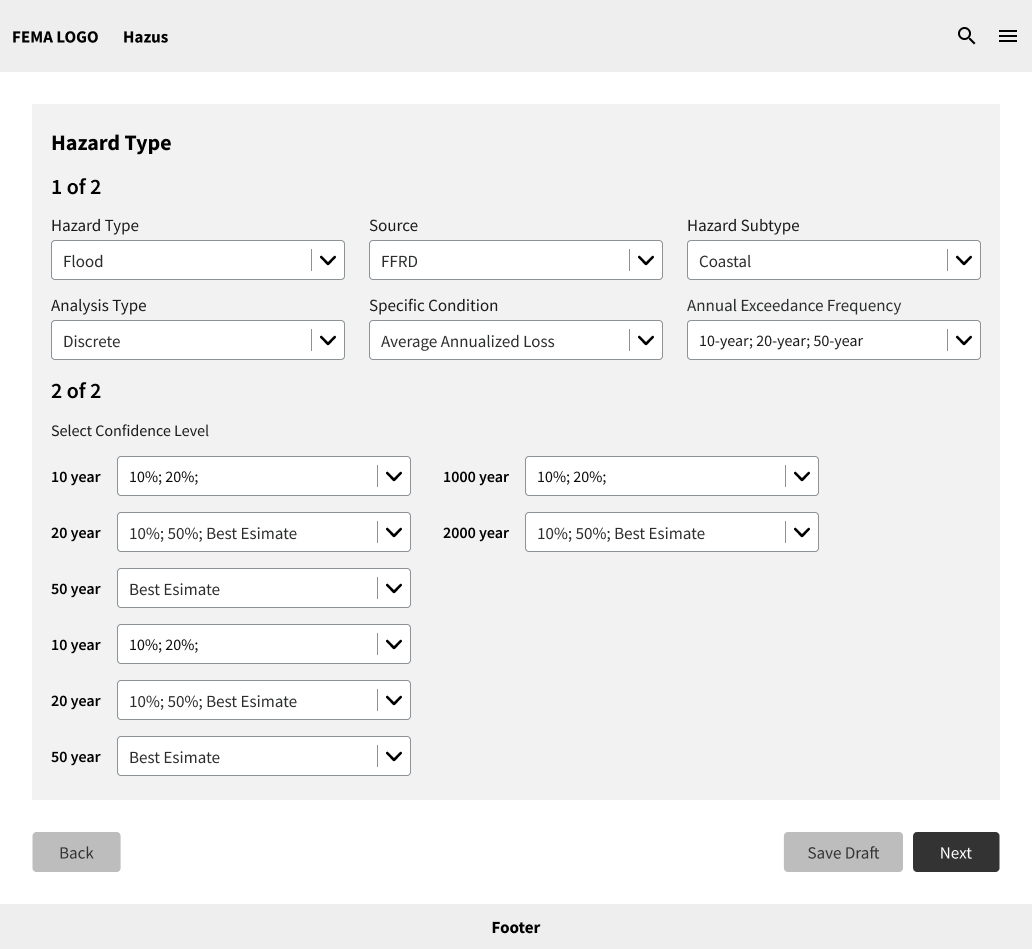
.png) Step 03
Step 03Downstream parameters update
The full set of input fields changes based on the combination selected. Users had no way to anticipate this without guidance.
Design Opportunity
The Hazard Tab presents analysts with a series of dependent sub-parameters, where each selection defines what appears next. Rather than exposing the entire form at once, I explored ways to reveal information progressively, reduce cognitive load, and keep users informed at every stage of the configuration.
Progressive disclosure of parameter fields
Instead of presenting all form fields at once, the layout sections the configuration into stages, displaying only the fields relevant to each step. This gives analysts a clearer sense of where they are in the process and reduces time spent figuring out options that may not apply to their scenario.
Contextual banners for conditional dependencies
The Hazard Configuration Tab is built around branching logic: the Event Type selection (Specific Conditions or Annual Exceedance Frequency) determines the entire set of fields, checkboxes, and dropdowns that follow. Without clear guidance, this conditional structure left many users confused.
To address this, information banners were introduced that clearly communicate the relationship between a user's selection and what appears next, displaying messages such as "You selected Annual Exceedance Frequency; the following options reflect that scenario," helping users understand why the interface changes.
Use interactive diagram below to understand the dependencies
Outcomes & Reflection
The redesigned Hazard Tab structures the parameter configuration process in a way that meets analysts where they are — whether they are experienced Hazus users or approaching the tool for the first time.
What was achieved
The final design received approval from the Product Owner, noting that the step-by-step interaction flow was a great improvement and the handling of parameter dependencies was particularly effective. The relationship between selections was clearly communicated in a way that earlier wireframes had not achieved.
As the platform evolves to include additional hazard types — tsunamis, earthquakes — each with their own unique parameters, the modular boxed layout is already equipped to accommodate these additions without requiring a fundamental redesign.
Designing for a technically complex domain reinforced the importance of making system logic visible to users. The conditional parameter dependencies in the Hazard Tab were not a problem that could be solved by simplifying the interface alone — the relationships between inputs needed to be communicated, not hidden.
Working within a team on both case studies gave me a clearer understanding of how to align design direction quickly when collaborating under project constraints.
If I could do one thing differently: I would have mapped the full conditional logic diagram earlier in the process and used it as a shared reference with the development team from day one.